The final quarter of the year can make or break your business goals. For small businesses, Q4 is about pushing end-of-year sales and understanding what’s actually driving results. Tracking the right small business metrics helps you make smarter decisions, improve performance, and plan strategically for the year ahead. From revenue per customer to retention rate, these numbers tell the story behind your growth, costs, and customer loyalty.
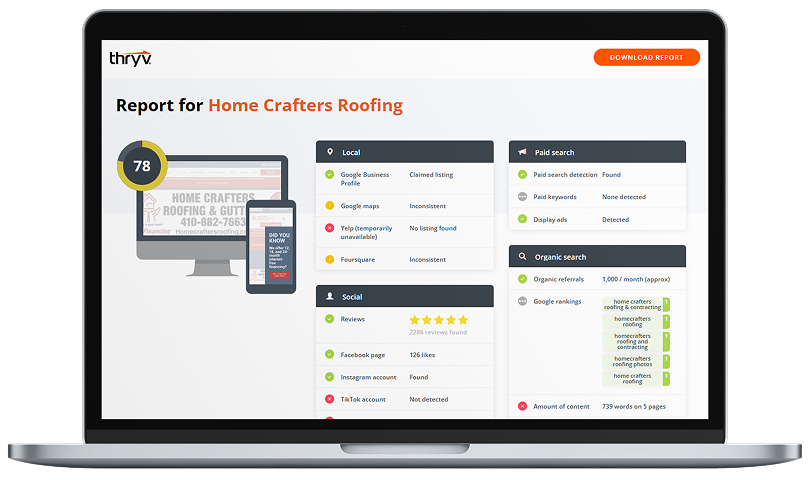
With Thryv’s real-time dashboards and reporting, you can view these key insights across marketing, sales, and operations – all from one centralized hub. That means no more guessing what’s working or where to adjust. In this post, we’ll break down five essential metrics to monitor this quarter, explain why they matter for your Q4 reporting, and show how an easy-to-use performance dashboard can simplify the process for every SMB.
Small Business Metrics to Track
1. Retention rate.
2. Revenue per customer.
3. Acquisition cost.
4. Conversion rate.
5. Average response time.
Build Stronger Relationships With Your Customers Using Our Mobile CRM Software for Small Businesses
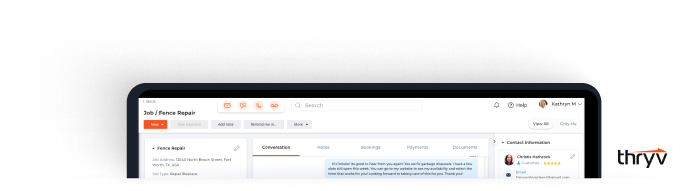
Our robust CRM software helps you build better relationships with your existing customers and nurture new leads. You can also view and manage all your communications and interactions from anywhere, including on your mobile device or desktop computer.
1. Retention rate.
Retention rate shows how many customers stick with your business over time – an essential indicator of customer loyalty and satisfaction. As Q4 wraps up, this metric reveals whether your year-long efforts to build trust, deliver value, and provide quality service are paying off. A strong retention rate means recurring revenue and reduced acquisition costs going into the new year. Using a performance dashboard, you can track repeat purchases, appointment frequency, or subscription renewals at a glance. With Thryv’s CRM and automated follow-up tools, you can segment loyal customers, send timely reminders, and re-engage clients before they drop off. This can help you boost long-term growth and improve your Q4 reporting.
2. Revenue per customer.
This metric measures how much income you earn from each customer on average, highlighting the value of your existing relationships. In Q4, when profit margins matter most, knowing your revenue per customer helps you identify upselling and cross-selling opportunities to maximize end-of-year income. Within a performance dashboard, you can visualize this data alongside sales trends, making it easier to spot your most valuable customer segments. Thryv’s Business Center dashboard centralizes this information, allowing you to filter by service type, date range, or customer group so that you can fine-tune pricing, promotions, and loyalty programs before year-end.
3. Acquisition cost.
Customer acquisition cost (CAC) tells you how much you spend to gain a new customer. It’s one of the most telling small business metrics when evaluating marketing effectiveness, especially in Q4, when campaign budgets peak. Tracking CAC ensures you’re not overspending on ads or underperforming channels as the year closes. A performance dashboard lets you compare ad spend against lead conversions for a clear ROI snapshot. With Thryv’s Marketing Center, you can monitor lead sources, ad performance, and conversion data all in one place. This can help you refine campaigns and make smarter spending decisions before finalizing your Q4 reporting.
Free Guide: AI and Small Business Adoption Report 2025
Explore real examples of small businesses using AI to boost efficiency, reduce costs, and put more time back in their day.
Download
4. Conversion rate.
Your conversion rate measures how effectively you turn leads into paying customers, a key driver of sales success in Q4. This metric reveals the efficiency of your website, social ads, and sales follow-ups at closing deals when customer activity is at its highest. A simple performance dashboard shows where prospects drop off and which campaigns bring in the most qualified leads. Thryv’s lead management and marketing analytics tools make this even easier, tracking the whole customer journey from inquiry to payment. With real-time updates, you can quickly identify what’s working and pivot fast to hit your end-of-year sales targets.
5. Average response time.
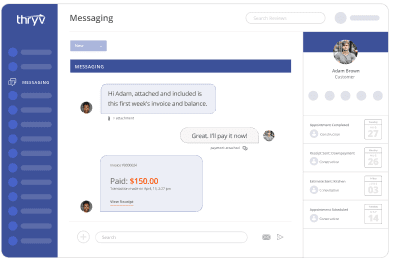
Average response time reflects how quickly your business engages with leads or customers, a detail that directly impacts conversions and retention, especially during the busy Q4 rush. Slow replies can mean missed opportunities, while fast responses drive trust and repeat business. A performance dashboard helps you monitor communication efficiency across platforms, ensuring your team stays responsive and consistent. With Thryv’s centralized inbox and automated messaging, you can streamline all customer interactions in one place, respond faster, and maintain top-tier service quality. That efficiency not only strengthens relationships but also boosts your Q4 reporting metrics for customer satisfaction and retention.
Turn Insights Into Action Before Year-End
Tracking the right metrics isn’t just about collecting data; it’s about using those insights to make smarter, faster business decisions when they matter most. As Q4 comes to a close, understanding the metrics above provides the clarity needed to finish strong and plan with confidence. With Thryv’s real-time dashboards and reporting, every key performance indicator is visible in one place – marketing, sales, and operations – so you can see what’s working, fix what’s not, and set your business up for growth in the new year. Don’t just measure success; manage it with Thryv.

The Guide to AI for
Small Business
Explore real ways AI can help your small business save time, automate tasks, and drive faster, smarter growth.