Home » Company News » Thryv Grows SaaS Revenue 24% in First Quarter 2024, Raises Full Year SaaS Guidance
Company News
Thryv Grows SaaS Revenue 24% in First Quarter 2024, Raises Full Year SaaS Guidance
By Thryv Contributor|
05.02.24
|
8 min read
– Grows SaaS subscribers 30% year-over-year – Optimizes capital structure by refinancing maturing credit facility – Announces $40 million inaugural share repurchase program
DALLAS, May 2, 2024 – Thryv Holdings, Inc. (NASDAQ:THRY) (“Thryv” or the “Company”), the provider of Thryv®, the leading small business software platform, reported SaaS revenue growth of 24% year-over-year in the first quarter of 2024.
“We are pleased with our first quarter results and are raising SaaS guidance for the full year,” said Joe Walsh, Thryv Chairman and CEO. “Today’s authorization of our first-ever share repurchase program demonstrates the confidence we have in our continued financial momentum and business trajectory. We have also finalized a more flexible credit agreement that provides us incremental cost savings as well as enhanced financial flexibility. Further development of our market-leading software is now in the capable hands of Rees Johnson, our new Chief Product Officer, who will direct the evolution of our product strategy. Rees has over 20 years of product leadership experience and will bring a collaborative and quality focused discipline to our product process.”
“It’s exciting to be leading the next phase of growth in Thryv’s platform innovation and ensuring all of our clients experience the value of our products,” said Rees Johnson, Chief Product Officer. “I can’t think of many jobs more challenging than that of a small business owner, and it’s an honor to lead a talented product team dedicated to making it easier for our clients to grow and more efficiently operate their business.”
Additionally, today Thryv issued an 8-K detailing the refinancing of its Term Loan and ABL, along with a press release regarding its new share repurchase program.
“We had a solid start to 2024 and raising full year guidance for SaaS,” stated Paul Rouse, Chief Financial Officer. “In the first quarter, we reported SaaS revenue growth of 24% and our primary focus continues to be accelerating profitable growth in the SaaS business while maintaining a strong and healthy balance sheet.”
First Quarter 2024 Highlights:
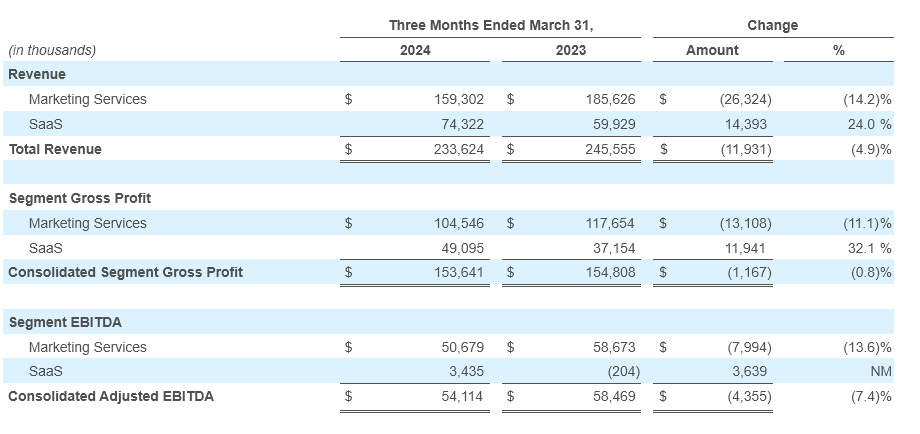
Total SaaS revenue was $74.3 million, a 24% increase year-over-year
Total Marketing Services revenue was $159.3 million, a 14% decrease year-over-year
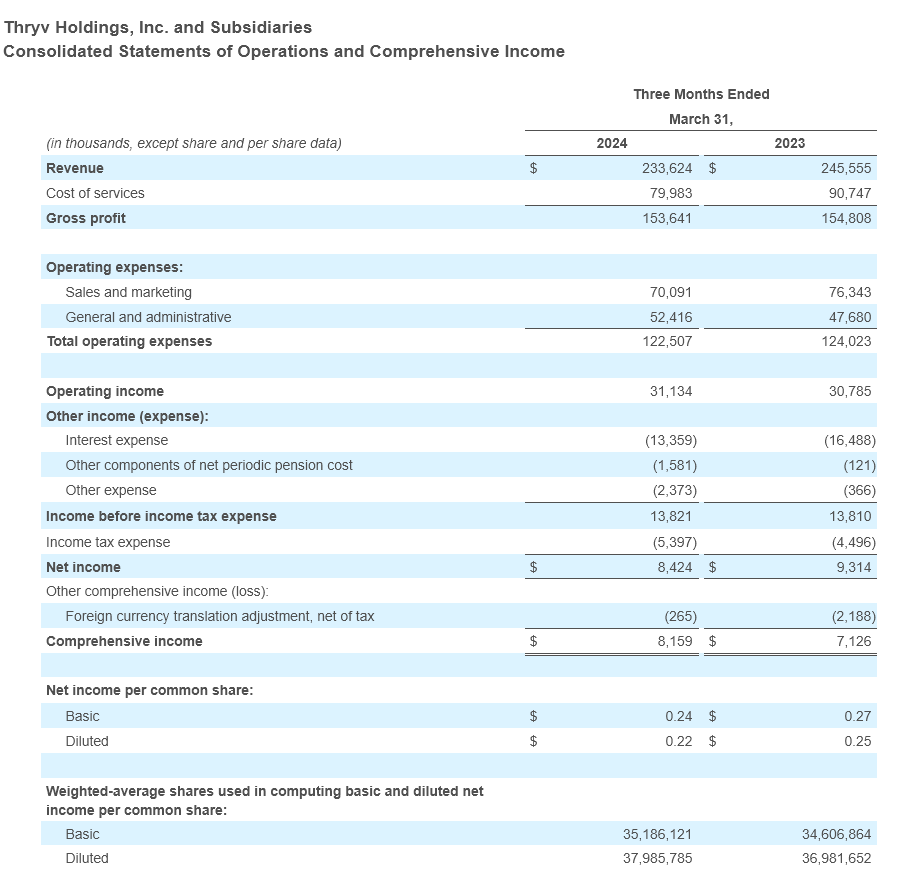
Consolidated total revenue was $233.6 million, a decrease of 5% year-over-year
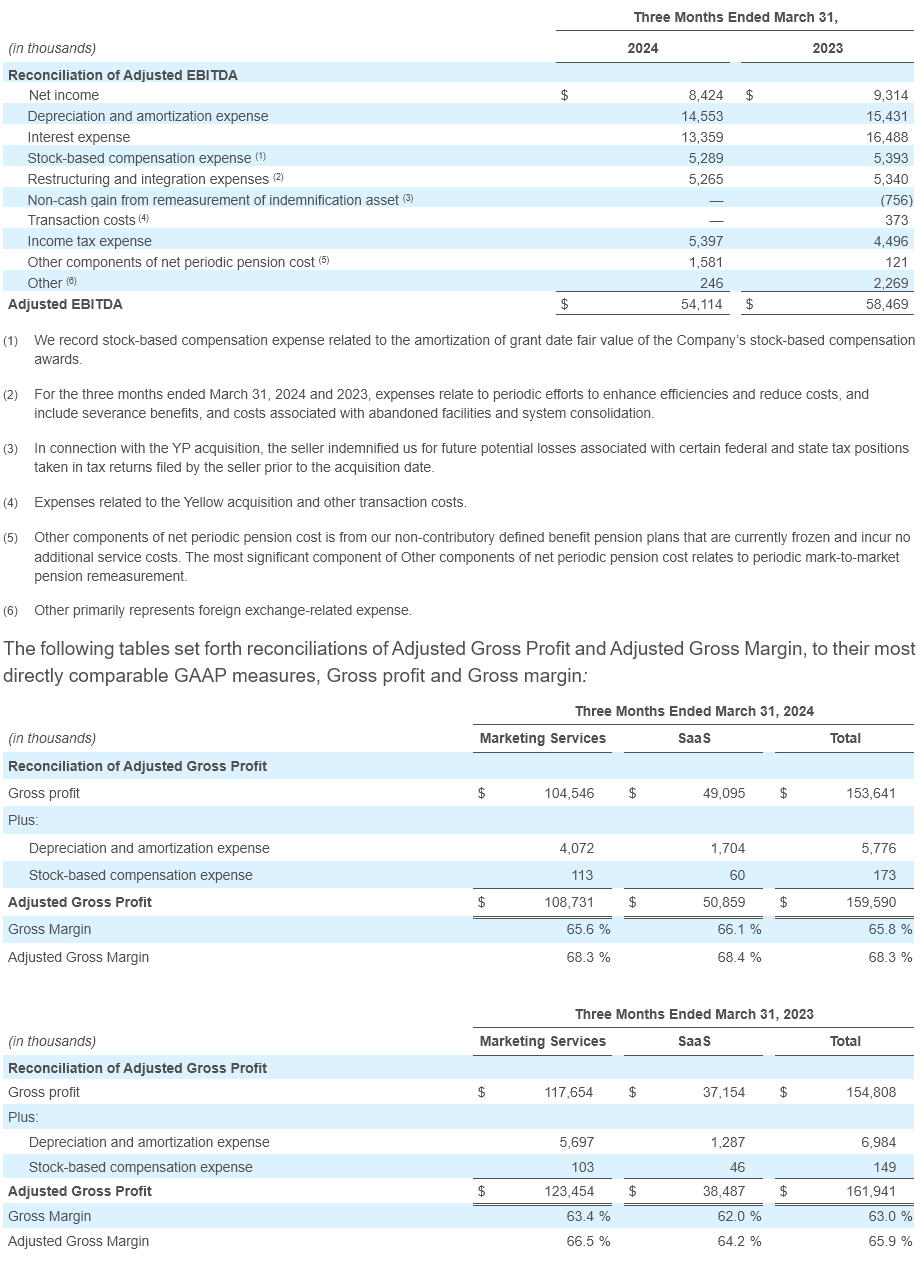
Consolidated net income was $8.4 million, or $0.22 per diluted share; compared to net income of $9.3 million, or $0.25 per diluted share, for the first quarter of 2023
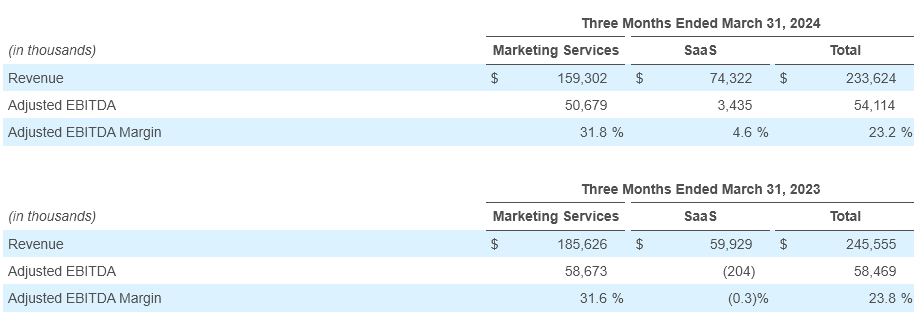
Consolidated Adjusted EBITDA was $54.1 million, representing an Adjusted EBITDA margin of 23.2%
Total SaaS Adjusted EBITDA was $3.4 million, representing an Adjusted EBITDA margin of 4.6%
Total Marketing Services Adjusted EBITDA was $50.7 million, represent
ing an Adjusted EBITDA margin of 31.8%
Consolidated Gross Profit was $153.6 million
Consolidated Adjusted Gross Profit1 was $159.6 million
SaaS Gross Profit was $49.1 million
SaaS Adjusted Gross Profit was $50.9 million, representing an Adjusted Gross Profit Margin of 68.4%
SaaS Metrics
Total SaaS clients increased 30% year-over-year to 70 thousand for the first quarter of 2024
Seasoned Net Dollar Retention2 was 94% for the first quarter of 2024, an increase of 300 bps year-over-year
SaaS monthly Average Revenue per Unit (“ARPU”)3 was $369 for the first quarter of 2024
ThryvPay total payment volume was $62 million, an increase of 40% year-over-year
1 Defined as Gross profit adjusted to exclude the impact of depreciation and amortization expense and stock-based compensation expense.
2 Seasoned Net Dollar Retention is defined as net dollar retention excluding clients acquired over the previous 12 months.
3 Defined as total client billings for a particular month divided by the number of clients that have one or more revenue-generating solutions in that same month.
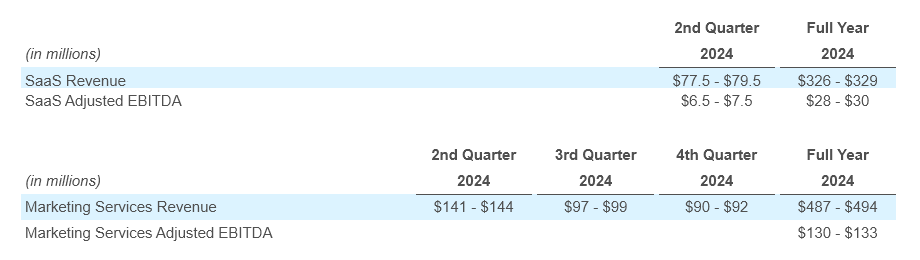
Outlook
Based on information available as of May 1, 2024, Thryv is issuing guidance4 for the second quarter of 2024 and full year 2024 as indicated below:
Earnings Conference Call Information
Thryv will host a conference call on Thursday, May 2, 2024 at 8:30 a.m. (Eastern Time) to discuss the Company’s first quarter 2024 results.
For analysts to register for this conference call, please use this link. After registering, a confirmation email will be sent, including dial-in details and a unique code for entry. We recommend registering a day in advance or at a minimum thirty minutes prior to the start of the call. To listen to the webcast, please use this link or visit Thryv’s Investor Relations website at investor.thryv.com. A live webcast will also be available on the Investor Relations section of the Company’s website at investor.thryv.com.
If you are unable to participate in the conference call, a replay will be available. To access the replay, please dial (800) 770-2030 or (647) 362-9199 and enter “44819.”
4 These statements are forward-looking and actual results may materially differ. Refer to the “Forward-Looking Statements” section below for information on the factors that could cause our actual results to materially differ from these forward-looking statements.
Segment Information
During first quarter of 2024, the Company changed the internal reporting provided to the chief operating decision maker (“CODM”). As a result, the Company reevaluated its segment reporting and determined that Thryv U.S. Marketing Services and Thryv International Marketing Services should be reflected as a single reportable segment, and that Thryv U.S. SaaS and Thryv International SaaS should be reflected as a single reportable segment. As such, beginning on January 1, 2024, the results of our Marketing Services and SaaS businesses will be presented as two reportable segments. Comparative prior periods have been recast to reflect the current presentation.
The following tables summarize the operating results of the Company’s reportable segments:
Non-GAAP Measures
Our results included in this press release include Adjusted EBITDA, Adjusted EBITDA Margin and Adjusted Gross Profit, which are not presented in accordance with U.S. generally accepted accounting principles (“GAAP”). These non-GAAP measures are presented for supplemental informational purposes only and are not intended to be considered in isolation or as a substitute for, or superior to, financial information prepared and presented in accordance with GAAP. Please refer to the supplemental information presented in the tables below for a reconciliation of Adjusted EBITDA to Net income and Adjusted Gross Profit to Gross profit. Both Net income and Gross profit are the most comparable GAAP financial measure to Adjusted EBITDA and Adjusted Gross Profit, respectively. Adjusted EBITDA margin is defined as Adjusted EBITDA divided by revenue.
We believe that these non-GAAP financial measures provide useful information about our financial performance, enhance the overall understanding of our past performance and allow for greater transparency with respect to important metrics used by our management for financial and operational decision-making. We believe that these measures provide additional tools for investors to use in comparing our core financial performance over multiple periods with other companies in our industry. However, it is important to note that the particular items we exclude from, or include in, our non-GAAP financial measures may differ from the items excluded from, or included in, similar non-GAAP financial measures used by other companies in the same industry.
The following is a reconciliation of Adjusted EBITDA to its most directly comparable GAAP measure, Net income:
Supplemental Financial Information
The following supplemental financial information provides Revenue, Adjusted EBITDA and Adjusted EBITDA Margin by (i) Marketing Services businesses and (ii) SaaS businesses. Total SaaS Adjusted EBITDA and Adjusted EBITDA margin are non-GAAP financial measures. Total Marketing Services Adjusted EBITDA and Adjusted EBITDA margin are also non-GAAP financial measures. These non-GAAP financial measures are presented for supplemental informational purposes only and are not intended to be considered in isolation or as a substitute for, or superior to, financial information prepared and presented in accordance with GAAP. Please refer to the supplemental information presented in the tables below for a reconciliation of these non-GAAP financial measures to the corresponding segment financial measures presented in accordance with GAAP.
We believe that these non-GAAP financial measures provide useful information about our global SaaS and Marketing Services financial performance, enhance the overall understanding of our global SaaS and Marketing Services past financial performance and allow for greater transparency with respect to important metrics used by our management for financial and operational decision-making. We believe that these measures provide additional tools for investors to use in comparing our core financial performance over multiple periods.
Forward-Looking Statements
Certain statements contained herein are not historical facts, constitute “forward-looking statements” within the meaning of the Private Securities Litigation Reform Act of 1995 and involve a number of risks and uncertainties. Statements that include the words “may”, “will”, “could”, “should”, “would”, “believe”, “anticipate”, “forecast”, “estimate”, “expect”, “preliminary”, “intend”, “plan”, “target”, “project”, “outlook”, “future”, “forward”, “guidance” and similar statements of a future or forward-looking nature identify forward-looking statements. These statements are not guarantees of future performance. These forward-looking statements are based on our current expectations and beliefs concerning future developments and their potential effect on us. While management believes that these forward-looking statements are reasonable as and when made, there can be no assurance that future developments affecting us will be those that we anticipate. Accordingly, there are or will be important factors that could cause our actual results to differ materially from those indicated in these statements. We believe that these factors include, but are not limited to, the risks related to the following: the Company’s ability to maintain adequate liquidity to fund operations; the Company’s future operating and financial performance; the Company’s ability to consummate acquisitions, or, if consummated, to successfully integrate acquired businesses into the Company’s operations, the Company’s ability to recognize the benefits of acquisitions, or the failure of an acquired company to achieve its plans and objectives; limitations on our operating and strategic flexibility and the ability to operate our business, finance our capital needs or expand business strategies under the terms of our credit facilities; our ability to retain existing business and obtain and retain new business; general economic or business conditions affecting the markets we serve; declining use of print yellow page directories by consumers; our ability to collect trade receivables from clients to whom we extend credit; credit risk associated with our reliance on small and medium sized businesses as clients; our ability to attract and retain key managers; increased competition in our markets; our ability to obtain future financing due to changes in the lending markets or our financial position; our ability to maintain agreements with major Internet search and local media companies; reduced advertising spending and increased contract cancellations by our clients, which causes reduced revenue; and our ability to anticipate or respond effectively to changes in technology and consumer preferences as well as the risks and uncertainties set forth in the Company’s most recent Annual Report on Form 10-K and subsequent Quarterly Reports on Form 10-Q filed with the Securities and Exchange Commission. All subsequent written and oral forward-looking statements attributable to us or persons acting on our behalf are expressly qualified in their entirety by such cautionary statements.
If one or more events related to these or other risks or uncertainties materialize, or if our underlying assumptions prove to be incorrect, actual results may differ materially from what we anticipate. For these reasons, we caution you against relying on forward-looking statements. All forward-looking statements included in this press release are expressly qualified in their entirety by the foregoing cautionary statements. These forward-looking statements speak only as of the date hereof and, other than as required by law, we undertake no obligation to publicly update or revise any forward-looking statements, whether as a result of new information, future events or otherwise.
About Thryv Holdings, Inc.
Thryv Holdings, Inc. (NASDAQ:THRY) is the provider of the leading do-it-all small business software platform that empowers small businesses to modernize how they work. It offers small business owners everything they need to communicate effectively, manage their day-to-day operations, and grow — all in one place — giving up to 20 hours back in their week. Thryv’s customizable platform features three centers: Thryv Command Center, a freemium central communications hub, Business CenterSM and Marketing CenterSM. Over 300,000 businesses globally use Thryv to connect with local customers and take care of everything they do, start to finish. For more information, visit thryv.com.
Media Contact:
Julie Murphy
Thryv, Inc.
617.967.5426 [email protected]
Investor Contact:
Cameron Lessard
Thryv, Inc.
214.773.7022 [email protected]
Terms and conditions apply. Free plans have limited functionality. Upgraded plans with more functionality are available for a fee. See https://corporate.thryv.com/terms/ for plan and pricing details.